
Research
Essence of the Cross Section (JMP)
(SSRN, Slides (short), 2-min summary video, mentions (X, Linkedin), Blog Post, Data and Code)
- Best Job Market Paper Award at the 8th Asset Pricing LTI Conference 2025
- 1000+ downloads in SSRN
- Presentations: European Finance Association (EFA), 2024; FMA European Conference, 2024; Erasmus University Rotterdam, 2025; Vrije Universiteit (VU) Amsterdam, 2025; Robeco Asset Management, 2025; LTI Asset Pricing Conference, 2025; Copenhagen Business School, 2023; Nordic Finance Network Workshop, 2024; GSE Econometrics Workshop, 2024; GSF Winter Workshop, 2023; Aalto University, 2023; University of Guelph, 2025; Wilfrid Laurier University Waterloo 2025; Young Scholars Nordic Finance Workshop 2025, Aarhus.

Which characteristics distinguish low-mean from high-mean stocks? The figure shows each characteristic’s contribution to the distance between losers and winners. Short-term reversal is the most important (7.8%), while about six characteristics together explain 25%.
Abstract: I develop a method to identify the strongest predictors of expected returns. Instead of sorting by return predictors, I sort stocks into portfolios directly by realized returns. These portfolios proxy for sorting on unknown factor exposures. I then construct out-of-sample portfolios that best resemble these return-sorted portfolios regarding a large set of characteristics, their non-linearities, and interactions. I show theoretically that this sorting is the closest strategy to sorting on SDF exposures. Empirically, it outperforms prominent machine learning methods. Comparing characteristics of loser and winner stocks, I find price-based characteristics and their interactions are the strongest predictors of future returns.
Read my blog post: what is the essence of the “Essence of the Cross Section”?
Revise & Resubmit, Journal of Financial and Quantitative Analysis (JFQA)
(SSRN, 5-min presentation, Data and Code, Slides (short), Poster, Blog Post)
- Invited to JFQA via a dual conference submission
- Best PhD paper award at GSF workshop 2024
- Presentations: Future of Financial Information Conference, 2025; Robeco Asset Management, 2025; Aalto University, 2023; GSF Summer Workshop, 2024.
This figure shows my high-dimensional portfolio sort that forms basis portfolios. The algorithm groups stocks into equally sized portfolios (e.g., deciles) such that stocks within each have the closest characteristics. With a single characteristic, the method reduces to the standard univariate sort in the literature.
Abstract: I propose creating a small set of well-diversified high-dimensional basis portfolios such that stocks within (across) portfolios have the most (least) similar fundamentals, proxied by a large set of characteristics. If expected returns and comovement between stocks are determined by a large set of characteristics, the high-dimensional basis portfolios that are distinct in all characteristics show low comovements and high dispersion in expected returns. As a result, the optimal portfolio spanned by high-dimensional basis portfolios displays a sizeable out-of-sample Sharpe ratio of 1.78 with a monthly alpha of 1.71% (t = 11.11), without taking any extreme position on any asset.
Read my blog post: what is the basis of “Basis Portfolios”?
(SSRN, Slides, Code, Poster, Internet Appendix, Blog post)
- Presentations: AFA Poster Session, 2024; FMA Annual Meeting, 2023; FMA European Conference, 2023; Nordic Finance Network Workshop, 2023; Finance Brown Bag Seminar, Aalto University, 2022; GSF Winter Workshop, 2022.
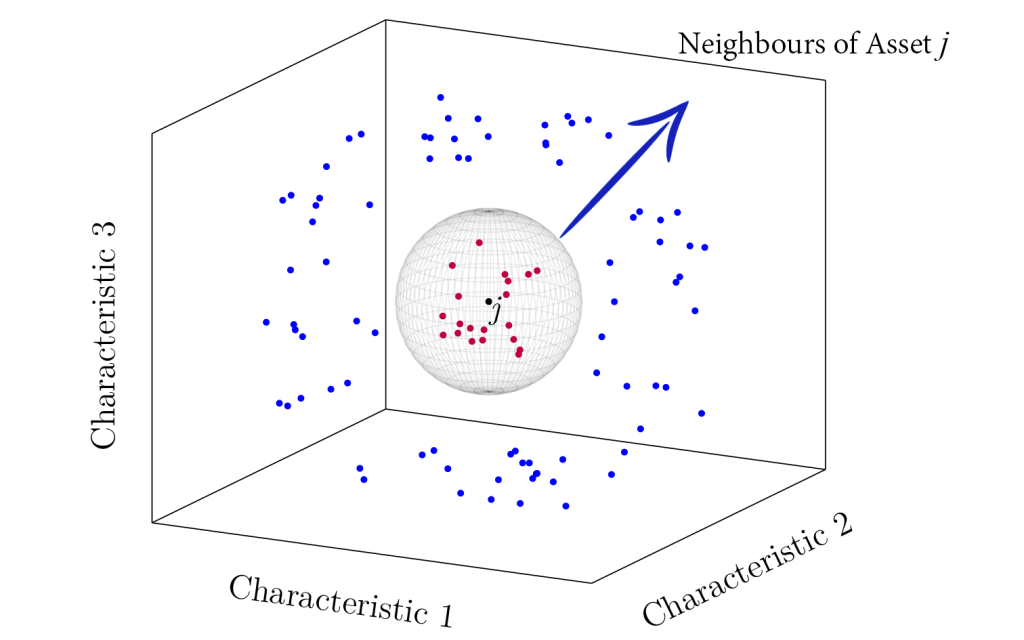
Abstract: Firms with similar characteristics display similar expected returns. Defining neighbouring assets as those with the most similar set of characteristics, I show that past returns of an asset’s neighbours predict its future expected returns. If a majority of an asset’s neighbours have performed poorly (well) in the past, it is likely that this asset also performs poorly (well) in the future. By classifying each asset into a decile portfolio based on the past performance of its neighbours, with 94 characteristics, a long-short portfolio generates an out-of-sample annualized Sharpe ratio of 1.40 with a monthly alpha of 1.75% (t = 9.45).
With three firm characteristics, the k closest assets to asset j (red dots) are its neighbors. If expected returns depend on characteristics—regardless of functional form—neighboring assets have similar expected returns.
(SSRN, Data and Code, Slides)
- Presentations: (2025) 10th RiskLab Finland, Bank of Finland and European Systemic Risk Board Joint Conference on AI and Systemic Risk Analytics.

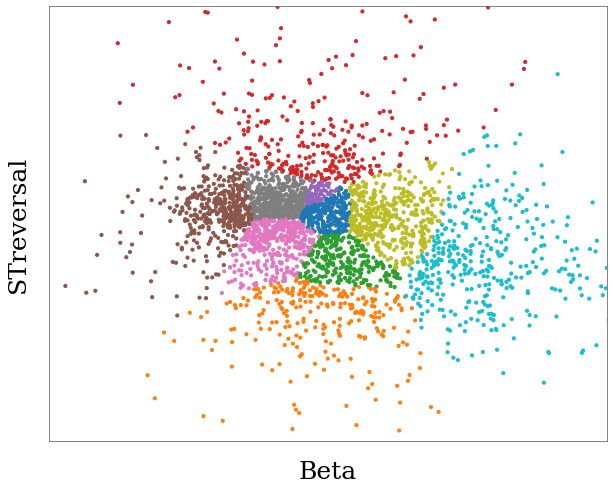
The figure shows the main risky words most predictive of future returns. I cluster them using vector representations from a word embedding model. Each word is plotted in 2D using the first two principal components of their embeddings. Words close in this space share similar meanings, and agglomerative clustering groups them into 14 color-coded clusters.
Abstract: To discover dynamic risks that determine the expected stock returns, I develop a method to predict returns through the text of firms’ risk disclosures. By cross-sectionally regressing returns on the text of risk disclosures, I find certain words in the risk discussions (defined as “risky words”) that have independent predictive power for the cross-section of stock returns: an out-of-sample strategy that times ”risky words” earns up to 22% annual alpha between 2005-2023.
Then using a word embedding model, I group risky words into 14 orthogonal clusters that are jointly eminent
determinants of expected returns. Firm characteristics, industries, sentiments, and previously discovered text features do not explain the results.
Previous Research
- Portfolio Value-at-Risk and expected-shortfall using an efficient simulation approach based on Gaussian Mixture Model (With A Sharifi and H Arian) Mathematics and Computers in Simulation, Volume 190, 2021, Pages 1056-1079
- This article came out from my master’s thesis.
Teaching
- Investments (2024), Exercise Sessions
- Avg evaluation: 4.5/5 (56 responses)
- Investments (2023), Exercise Sessions
- Avg evaluation: 4.2/5 (50 responses)
- Investments (2022), Exercise Sessions
- Avg evaluation: 4.1/5 (40 responses)
- Investment management (2021), Exercise Sessions
- Avg evaluation: 4.0/5 (101 responses)
- Machine Learning in Finance (2019), Exercise Sessions
- Statistics for Finance (2019), Exercise Sessions
- Financial Modeling with Python (Workshop) (2019)
Seyed Mohammad Sina Seyfi, سینا سیفی, سید محمد سینا سیفی
